
Introduction
In our two-part publication released earlier this year titled, Financial Planner vs. Investment Advisor: The Economics of Paying for Advice, we developed a research-driven, analytical framework for contrasting the value proposition of staying one step ahead of Wall Street with that of efficiently following its lead. In this segment, we will learn how to follow the various financial markets from the latter perspective through a deeper understanding of the variables that move them.
As detailed in the aforementioned article, there are two characteristics of risk-driven investing that render it more productive than pursuing alpha — its universality and efficiency. While collective market wisdom would never expect the deliberate allocation of capital to specific stocks within a particular asset class to be any more profitable than an arbitrary one, it would always favor the prudent synthesis of the categories themselves over the construction of a highly correlated portfolio. Furthermore, given that the latter approach does not demand the attention nor the urgency needed to beat other investment advisors to excess returns, it does not incur the associated research, trading, or tax costs either.
While this distinction might yield a compelling investing philosophy, it does not provide any perspective on how to think about current events such as extreme inflation, how to actually derive the assumptions needed for a long-term portfolio strategy, or how to evaluate its execution. To address these issues, we must once again turn to Finance 101.
Valuation and Volatility
The Constant Dividend Growth Model — the most fundamental valuation technique in the industry — defines the market price P of a stock as a function of:
D1/(E(r) − g)
Where:
D1 : The dividend each share is expected to yield in the year ahead
E(r) : The annual rate of return required by investors to purchase it
g : The annual rate of growth expected of its dividend payments
The idea behind this equation is that the present value of an investment is enhanced by its future cash flow expectations, but discounted by the opportunity cost of less volatile alternatives as defined by the CAPM. While this particular model relies on a degree of linearity that is atypical of most company forecasts, it nevertheless introduces a concept that is fundamental to understanding market behavior — that the price of an investment will move until the dividends it is expected to generate from that point forward will yield the appropriate rate of return.
To illustrate, let’s examine the hottest issue on Wall Street today — inflation. At the time of this writing on the morning of June 10th, 2022, the Consumer Price Index (CPI) data for the month of May has just been released — reflecting an increase of 8.6% in the prices of domestic goods and services since this time last year. While financial planners and investment advisors might agree on the economic significance of this development, their responses to it will differ considerably.
Investment advisors will focus on immediately liquidating investments that stand to lose the most from persistent inflation and its associated interest rate hikes before their competitors manage to push market prices down, while using the sale proceeds to purchase assets which tend to appreciate in anticipation of rising consumer prices. Given their mandate to outperform a stated benchmark, these “active” managers must quickly recalibrate their pricing models to capture this news before it is reflected in the index.
Financial planners on the other hand are all too familiar with the evidence suggesting that such attempts will be futile, and will choose to observe as active managers reprice the market at the expense of each other and their clients. Once the dust settles, they will consider how to traverse the new landscape most efficiently and perhaps even modify the destination.
SIRIus Construction — A Case Study
Consider SIRIus Construction (AICON) — a theoretical company that uses artificially intelligent workers to construct commercial skyscrapers in major metropolitan areas. Despite offering a current dividend of just $2.50 as it reinvests in this disruptive technology, SIRIus’ prospects for future growth had its stock trading at $250/share prior to the CPI release. This valuation was based on the following metrics:
D1 : $2.50
E(r) : 9%
g: 8%
Plugging these numbers into the Constant Dividend Growth Model:
2.5/(.09 − .08) = 250
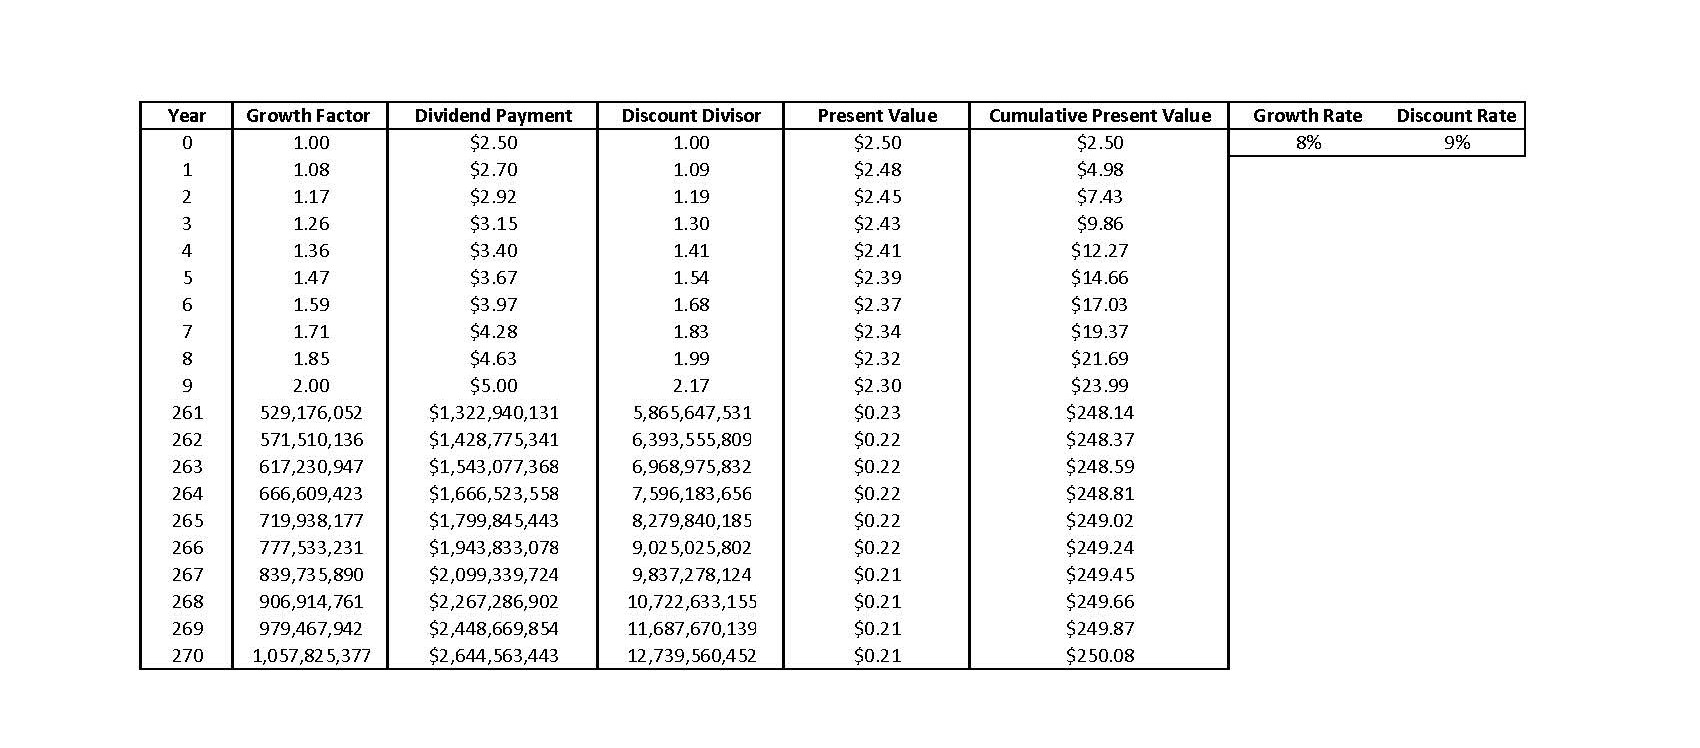
The exhibit below helps to illustrate this valuation technique by highlighting the present values of several near-term and terminal dividend payments expected of SIRIus. For years 0-9, and 261-270 i.e. in the very distant future, this table specifies the respective growth factors applied to the current dividend, the resulting dividend payments, the divisors by which these payments must be discounted due to their uncertain and distant nature, the resulting present values of each dividend, and finally the cumulative present value of all future dividends which roughly equates to our $250 algebraic calculation. Note that while the dividends in the later years are projected to be astronomical, they contribute very little to the current valuation due to the exponentially higher discount factors being applied to them.
While the upcoming dividend and its annual growth rate are fairly straightforward conventions, let’s unbundle the expected return assumption to better understand the risk dynamics of this fairly speculative investment.
Recall the CAPM equation:
E(r) = R(f) + (β x [R(m) – R(f)])
Where:
R(f): The expected yield on a risk-free asset, such as the 10-year Treasury bill
R(m): The expected return of the overall market, such as the relevant index
β: The relative interim volatility of SIRIus, or its beta
Given the 3% yield on the 10-year Treasury bill, the 7% return expected of the broader Russell 1000 Growth Index, and a beta of 1.5, investors were discounting future SIRIus dividends by:
.03 + (1.5 x [.07 – .03]) = .09, or 9%
In light of the latest inflation figures however, these parameters are subject to change.
Even Higher Rates?
Once the Federal Reserve announces further increases to the overnight rate at which it lends money to member banks, the yields on longer-term loans such as the 10-year Treasury bill may continue their ascent. Assuming the 10-year yield rises to 4% and investors continue to expect a 4% excess return in exchange for taking on stock market risk i.e. a constant [R(m) – R(f)], the E(r) of SIRIus would become:
.04 + (1.5 x [.08 – .04]) = .1, or 10%
The Emergence of a Known Unknown
While further changes to interest rate expectations would continue to shift the equilibrium of the financial markets, a more ephemeral narrative will likely emerge as well. Specifically, there will be further concern that these increased rate hikes will temporarily cripple critical economic foundations such as the housing and automobile industries and ultimately induce a recession. Until the GDP and other economic reports for the current quarter are released, active managers will have no choice but to discount future cash flows even further. For the purposes of this illustration, let’s assume the R(m) temporarily rises from 8% to 9%, implying an E(r) of:
.04 + (1.5 x [.09 – .04]) = .12, or 12%
While it will take some time before the fallout from this macroeconomic crisis on long-term company cash flow (g) will be ascertainable, there is one thing that can be said for certain — SIRIus will have some short-term profitability issues. Given their inability to pass the rising costs of their construction supplies onto their clients who are already struggling to cope with rising mortgage rates, they will simply have to settle for smaller profit margins at least for the time being. We can capture this change as well as the impact of the increased E(r) by modifying the initial valuation model as follows:
2/(.12 − .08) = 50
In other words, by reducing its upcoming dividend forecast from $2.50 to $2.00, and plugging in its required return of 12%, we can expect the price of SIRIus to be reduced by 80%. Thus, should SIRIus or any other stock drop in the wake of June 10, we will understand the reasons why — a lower D1 and a higher E(r) the latter of which would have both temporary [R(m)] and enduring [R(f)] elements.
Uncertainty Fades, Expectations Emerge
Assume that several months from now, it becomes clear that we are headed for a recession i.e. two consecutive quarters of GDP contraction — but at a rate somewhat lower than originally feared. While this phase would be very typical of a healthy economic cycle, its sooner than expected arrival would certainly put a damper on the growth expectations that prevailed earlier this year.
In the context of our case study, this might indicate an R(m) that reverts back to 8% and an equilibrium E(r) of 10%, but a g that settles in at a more modest 7.5% — suggesting a new market value of:
2/(.10 − .075) = 80
Thus, a portfolio composed exclusively of SIRIus stock would have lost $170/share, or 68% of its June 10 value.
The Silver Lining
While both the decline in g caused by recession and the increase in E(r) induced by the Fed’s attempt to curtail inflation might distance this portfolio from its destination, the latter variable would also equip it with a more powerful engine. To the extent that prices are reduced merely on account of improved risk-free alternatives rather than lower anticipated dividends, many investors would actually benefit from current events.
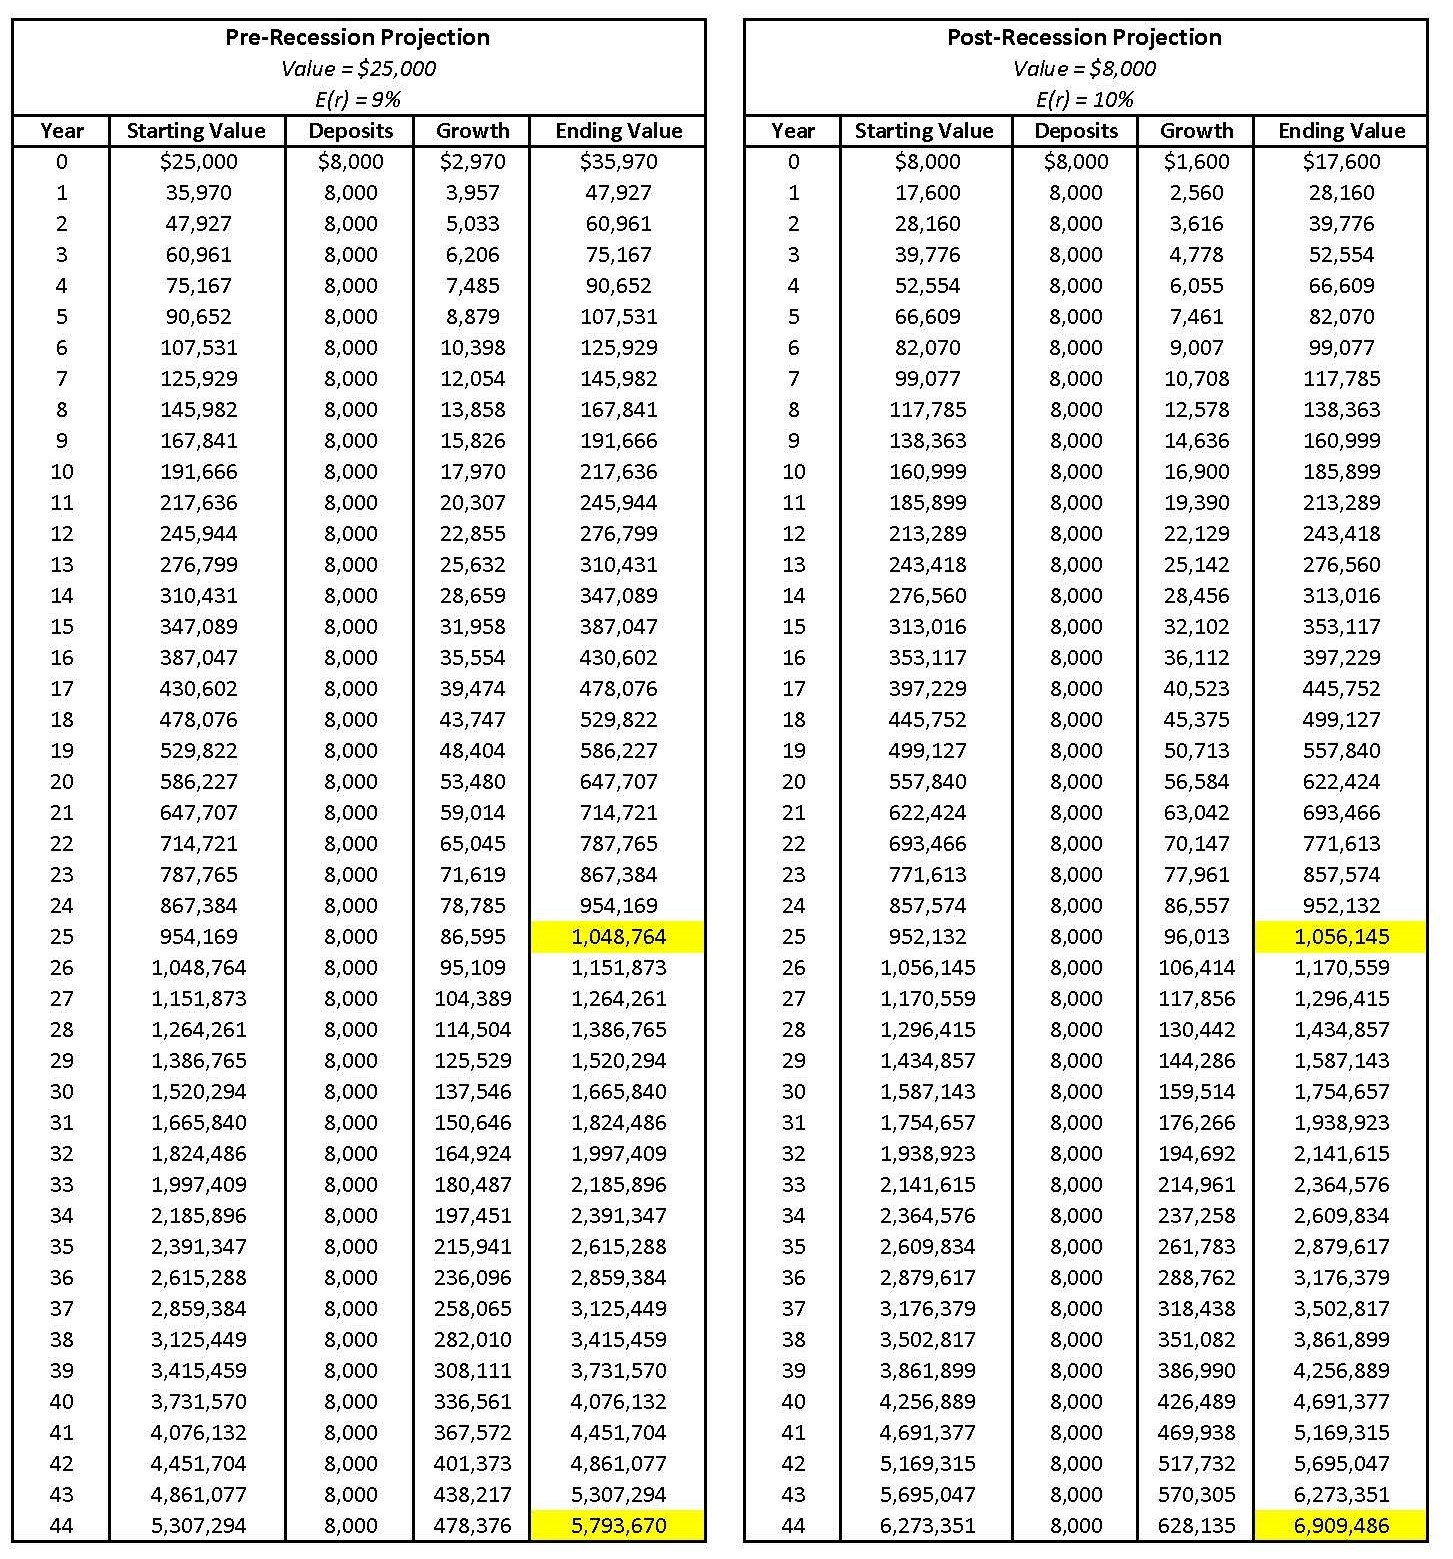
The following exhibit demonstrates this idea by comparing the outlook of a 100-share SIRIus portfolio before the May CPI release with one already pricing in the theoretical recession and higher interest rates. It assumes that the fairly young owner of these portfolios will purchase $8,000/year in additional shares for the foreseeable future. The analysis suggests that while the latter portfolio would start at a stark 68% disadvantage, it would catch up to its counterpart within 25 years and eclipse it by over $1 million by 2066 thanks to its additional 1% annual return. Clearly, the big picture impact of market volatility is not just a function of its intensity, but also of its cause and the specific objectives of the portfolio in question.
The Informed Consumer
Now that we understand the fundamentals of market pricing, we can better appreciate the various financial media headlines that might have featured throughout the course of the above narrative. Let’s contrast the reactions that an informed investor would have had to these segments with those of a casual consumer:
Headline #1: “J.P. Morgan adds SIRIus Construction to its list of The Hottest Stocks of 2022” — June 1, 2022
Summary: This article goes on to discuss SIRIus’ cutting-edge AI technology and the multi-billion dollar market share it could ultimately hold.
Uninformed Reaction: What an incredibly innovative company. Not only are its revenue growth projections incredibly attractive, but it is being recommended by a well-respected organization. I will replace 5% of my portfolio with this investment ASAP.
Informed Reaction: The article may have done an excellent job of describing this company’s prospects for growth, but it did not explain why its $250 market price is incorrect. Assuming that this valuation already incorporates an aggressive dividend growth rate assumption, why would I expect this stock to be bid up in the future and outperform its current expected return? Furthermore, I do not have the time to test the statistical significance of J.P. Morgan’s historical investment performance to ascertain if I can simply trust their judgement.
Headline #2: “Fed Chair Jerome Powell plans to continue interest rate hikes, which he warns could lead to a recession” — June 10, 2022
Summary: The author reports that the chairman of the Federal Reserve has committed to increase its overnight lending rate by any means possible to combat inflation even at the risk of recession.
Uninformed Reaction: I should probably get out of the market now before this recession becomes a reality. I think I will use the cash to pay down my mortgage so that I can reduce the risk of foreclosure in the event that I am laid off.
Informed Reaction: In light of the research I have done on the difficulty of outperforming the market, there is no chance that this increased risk of recession is not already reflected in today’s prices. While I realize that the market could potentially drop even further, my long-term goals might become permanently out of reach if I miss out on a recovery. I also recognize that any money that I reinvest into my portfolio over the long-term will earn higher yields than previously possible due to the Fed’s shift in monetary policy. Given that the rate on my mortgage is only 3.25%, it would make sense to weigh the increased market and foreclosure risk associated with maintaining this loan against the risk that my portfolio will miss out on the opportunity to keep up with future inflation.
Headline #3: “Recession Officially Realized as GDP Drops for Second Consecutive Quarter” — July 28, 2022
Summary: The U.S. Bureau of Economic Analysis releases its first estimate of Q2 Gross Domestic Product (GDP), suggesting a second consecutive 1.5% annualized GDP contraction. While this confirms the recession that many economists have been predicting since early 2022, it does not appear to be as extreme as many had feared and stocks are up as a result.
Uninformed Reaction: I have no idea why the markets improved today. I sold 50% of my portfolio back in June in anticipation of a recession only to miss out on a rebound when it became a reality. I think I will buy back in so that I do not miss out on a further recovery.
Informed Reaction: It seems as though the impact of recent inflation and Fed’s response is no longer a mystery. Now that we are getting back to a state of relative equilibrium, I should revisit my asset allocation to ensure that it is still optimal from a long-term perspective. While I am aware that I can use a combination of mean-variance optimization and Monte Carlo simulation to accomplish this, I do not know how to actually derive the requisite inputs such as the expected returns, standard deviations, and correlations of the various assets I might utilize.
I suppose I will need to read the next edition of FiveTwentyNine to become a truly Informed Investor.